The People Network has released the Indian Hospitality Compensation Survey 2025–26 — a comprehensive, independently conducted benchmarking study covering three distinct hotel segments: Budget, Upscale, and Luxury
This combined report brings together data from 888 participating hotel properties across India with over 22,000 data points — one of the most extensive compensation datasets available for the Indian hospitality sector.
The Rise of a New Generation: Hospitality Professionals from India’s Tier 2 and Tier 3 Towns
The future of employment in a Viksit Bharat is quietly taking shape in India’s Tier 2 and Tier 3 towns, where a new generation of hospitality professionals is emerging from small cities, semi-urban communities, and expanding local markets. As infrastructure improves and travel spreads beyond major metros, hotels across economy, budget, and midscale segments are becoming powerful platforms for employment in these emerging regions.
Insights from a workforce study covering 888 hotels across India show that the real employment momentum in hospitality is no longer concentrated in large metropolitan luxury hotels. Instead, it is being driven by economy and midscale hotels in smaller cities, where lean operating models and multi-skilled teams create large numbers of accessible entry-level roles. These properties often operate with compact teams, requiring employees to develop a broad set of practical skills—from guest service and operations to coordination across departments—making them ideal environments for first-generation professionals.
Across these hotels, roles in Food & Beverage Service, Housekeeping, Front Office, and Kitchen operations form the backbone of employment. These positions absorb a significant share of new entrants into the workforce, particularly young people who are stepping into formal employment for the first time. For many, hospitality offers not just a job but a gateway into the modern service economy, providing stable incomes, structured workplaces, and opportunities for career progression.
As India prepares to add nearly 120,000 new hotel rooms over the next five years, the expansion of hospitality into smaller cities will support an estimated 1.44 million livelihoods across the wider ecosystem. Much of this growth will occur in emerging markets—towns connected by new highways, airports, industrial corridors, and tourism circuits. In these locations, hotels often become anchor employers, drawing talent from surrounding districts and creating a pipeline of trained service professionals.
What makes this shift significant is the demographic transformation of the hospitality workforce. Young men and women from small towns, many first in their families to enter structured employment, are increasingly building careers in hotels across the country. Their journey reflects a broader economic transition, where opportunity is no longer limited to major urban centres but is expanding across India’s regional economies.
In this sense, the hospitality sector is doing more than serving travellers. It is nurturing a new generation of professionals from emerging India individuals whose aspirations, discipline, and service orientation are shaping the next chapter of the industry.

Natwar Nagar, Founder of The People Network and The Job Plus, and Co-Author – Indian Hospitality Compensation Survey 2025–26, said, “The story of India’s hospitality workforce, therefore, is also the story of economic mobility in smaller towns. As economy and midscale hotels expand across Tier 2 and Tier 3 markets, they are quietly building one of the country’s most inclusive employment pathways, transforming local youth into skilled professionals and turning emerging towns into the foundation of India’s service economy.”
Introduction & Report Overview
All compensation benchmarks are expressed as annual Cost to Company (CTC) in Indian Rupees (INR), presented at five percentile points (P25, P50, P66, P75, P90). This release spotlights the P75 (Upper Quartile) — where the top 25% of the market begins — across key roles and all three hotel segments.
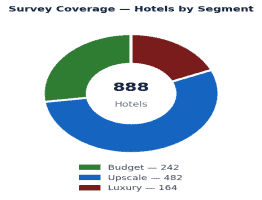
The survey covers three distinct hotel categories, each with a different service model, cost base, and talent profile. The table and chart below summarise coverage across segments.
| Segment | Hotels | Positions | Depts | RevPAR |
| Budget | 242 | 48 | 12 | +10.8% |
| Upscale | 482 | 90+ | 14 | +10.8% |
| Luxury | 164 | 50+ | 14 | +10.8% |
| Combined | 888 | 130+ | 14 | +10.8% |
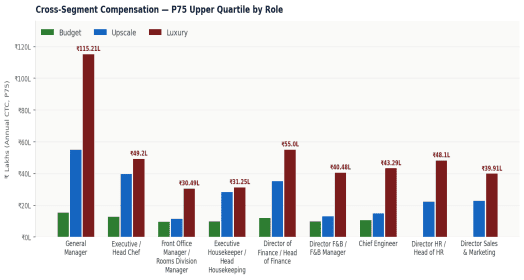
Cross-Segment Comparison — P75 Upper Quartile (₹ Lakhs)
The table below compares P75 (Upper Quartile) annual CTC for key roles across all three hotel segments — showing where the top 25% of market pay begins at each level of the hotel quality ladder.
| Position | Budget P75 | Upscale P75 | Luxury P75 | Uplift B→L |
| General Manager | ₹15.5L | ₹55.06L | ₹115.21L | +643% |
| Executive / Head Chef | ₹12.75L | ₹39.72L | ₹49.2L | +286% |
| Front Office Manager / Rooms Division Manager | ₹9.57L | ₹11.49L | ₹30.49L | +219% |
| Executive Housekeeper / Head Housekeeping | ₹9.83L | ₹28.26L | ₹31.25L | +218% |
| Director of Finance / Head of Finance | ₹11.95L | ₹35.26L | ₹55.0L | +360% |
| Director F&B / F&B Manager | ₹9.85L | ₹12.94L | ₹40.48L | +311% |
| Chief Engineer | ₹10.72L | ₹14.93L | ₹43.29L | +304% |
| Director HR / Head of HR | — | ₹22.3L | ₹48.1L | — |
| Director Sales & Marketing | — | ₹22.71L | ₹39.91L | — |
| Sous Chef | ₹8.41L | ₹7.59L | ₹10.2L | +21% |
| Guest Service Associate | ₹2.86L | ₹2.95L | ₹3.37L | +18% |
Uplift % = P75 Luxury vs P75 Budget for comparable roles. — = role not directly comparable.
“The P75–P90 corridor is where talent competition is fiercest. In Luxury, the gap between upper quartile and top decile exceeds ₹37 Lakhs for a General Manager — the market is signalling that differentiated leadership commands differentiated pay at every level of the hotel quality ladder.” – Indian Hospitality Compensation Survey 2025–26, The People Network.
Key Findings
| 1GM LUXURY SEGMENT P75 HITS ₹115.21L — 643% ABOVE BUDGET General Manager Upper Quartile (P75) in Luxury reaches ₹115.21L versus ₹15.50L in Budget — a 643% premium. The P75 marker signals where the top 25% of the market begins, reflecting the scale, brand complexity, and commercial accountability demanded of luxury hotel GMs. |
| 2HEAD OF FINANCE P75 REACHES ₹55.00L IN LUXURY Head of Finance Upper Quartile in Luxury is ₹55.00L versus ₹11.95L in Budget — a 360% uplift. Upscale sits at ₹35.26L, reflecting the growing complexity of financial governance across full-service hotel operations. |
| 3DIRECTOR HR LUXURY P75 AT ₹48.10L — STRATEGIC FUNCTION PREMIUM Director HR Upper Quartile in Luxury reaches ₹48.10L versus ₹22.30L in Upscale — a +116% segment premium. The P75 marker confirms that HR leadership is compensated as a strategic, not a support, function in luxury hotels. |
| 4EXECUTIVE HOUSEKEEPER / HEAD HOUSEKEEPING P75: UPSCALE ₹28.26L CLOSES IN ON LUXURY ₹31.25L Executive Housekeeper / Head Housekeeping Upper Quartile in Upscale (₹28.26L) comes within ₹3L of the Luxury P75 (₹31.25L). Premium-tier Upscale brands are benchmarking their housekeeping leadership at near-luxury rates, reflecting the direct link between this role and guest satisfaction scores. |
| 5CHIEF ENGINEER P75 JUMPS TO ₹43.29L IN LUXURY Chief Engineer Upper Quartile rises from ₹10.72L in Budget to ₹43.29L in Luxury — a 304% uplift. The Luxury P75 exceeds the Upscale figure (₹14.93L) by nearly 3×, confirming that technical building complexity in luxury properties creates a clearly distinct pay tier. |
| 6EXEC / HEAD CHEF P75 AT ₹49.20L IN LUXURY — +286% VS BUDGET Executive / Head Chef Upper Quartile climbs from ₹12.75L in Budget to ₹49.20L in Luxury — a 286% uplift. In Budget, culinary P75 (₹12.75L) nearly matches the GM (₹15.50L), reflecting the outsized commercial premium placed on culinary talent at all tiers. |
Methodology Note
The survey publishes five percentile reference points: P25, P50, P66, P75, and P90. All figures are annual Cost to Company (CTC) in Indian Rupees (₹ Lakhs), pre-bonus. P75 is the Upper Quartile — the point above which the top 25% of incumbents earn. Data was gathered from 888 hotels across functions and positions spanning Budget, Upscale, and Luxury segments. Data collection was completed by 30th December 2025. Benchmarks are indicative and should be contextualised against hotel tier, city market, brand, and organisational structure.
Read more: News
